Dashboard Overview
Create dashboard type resources, supporting users in configuring a variety of charts in dashboard resources, making complex data information easier to understand and analyze.
OpenPO Reports
Dashboard
Dashboards visually display data through charts, graphics, and gauges, making complex data information easier to understand and analyze.
Summarize key performance indicators and important data on one interface, making it convenient for users to quickly obtain core data of enterprises or projects.
Create/Configure Dashboards
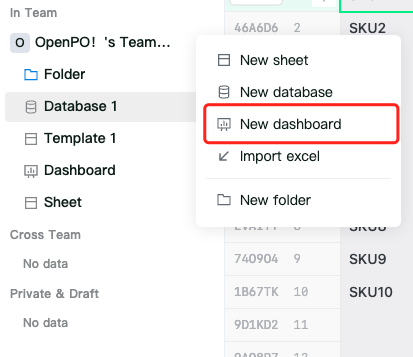
By hovering over the team space/folder and clicking the "+" button, add a dashboard to create a dashboard type resource.
Create Charts
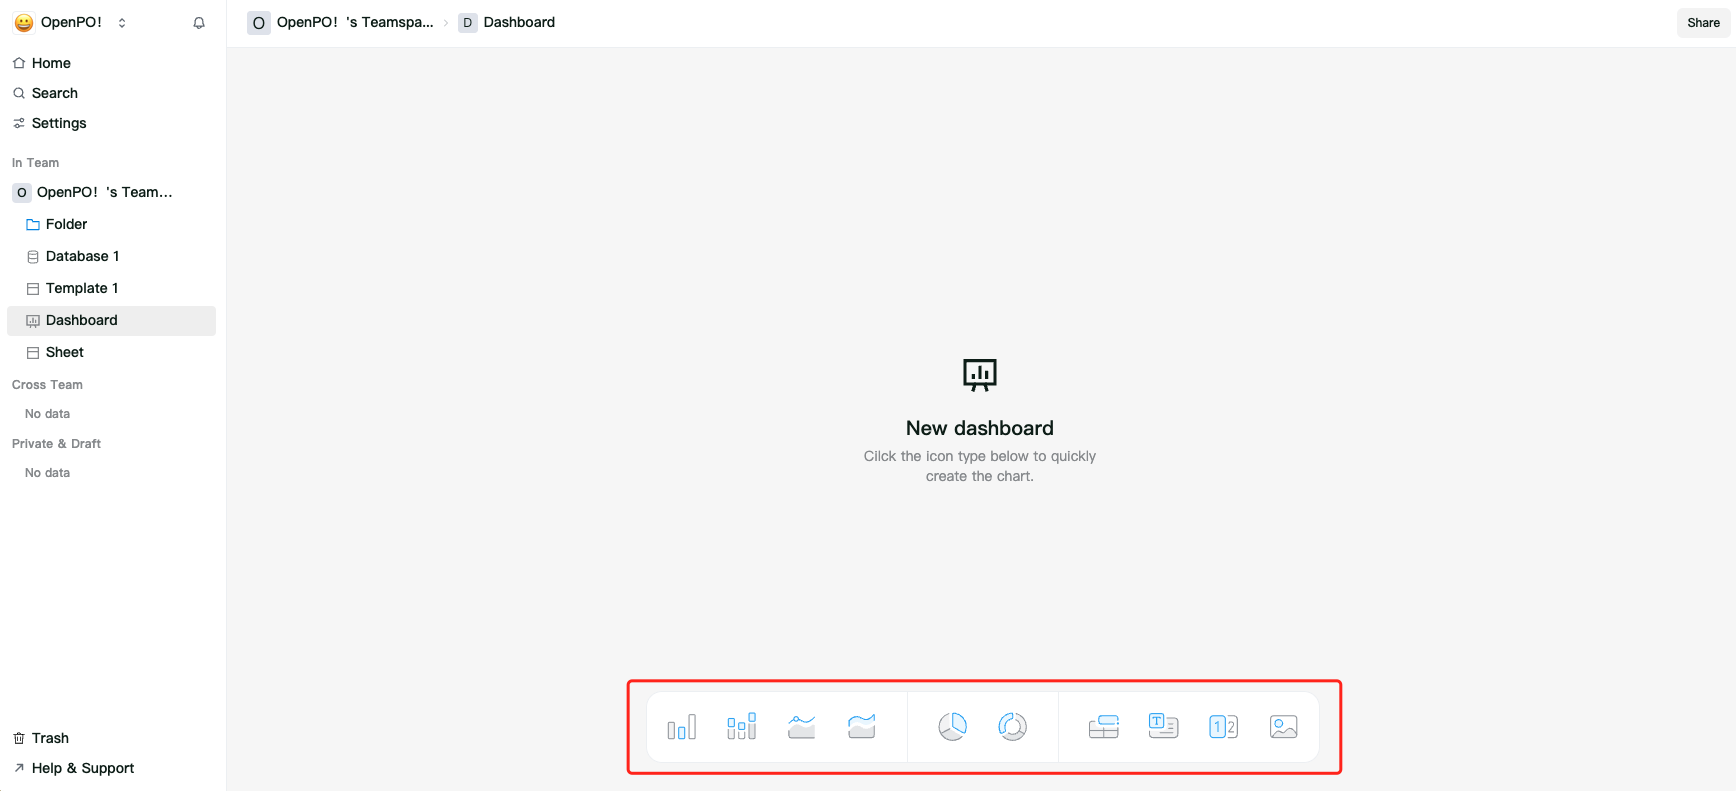
When you enter the dashboard page, you can create cards for the corresponding chart types through the quick bar. Click on the shortcut button to generate the card, and a configuration panel will appear on the right side.
After configuring the options in the right panel, the chart is created.
Supported Chart Types:
Pie charts、Line charts、Bar charts、Donut charts、Stacked line charts、Stacked bar charts、Numbers、Text、Cell content、Images
Deleting Charts
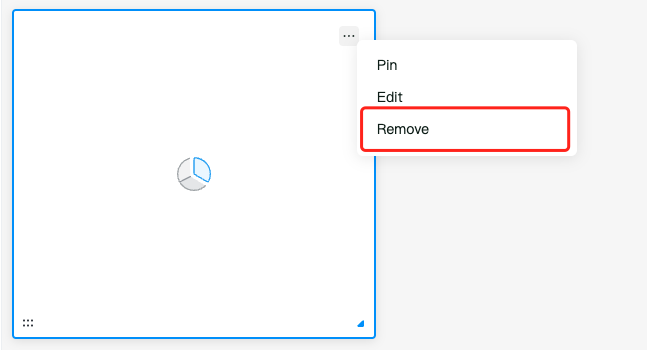
To delete a chart, click the action button in the top right corner of the chart card, and then click the remove option in the drop-down menu.
Sharing Charts
By clicking the share button in the top navigation bar, you can open the share popup. Users with full permissions can invite users who have registered in OpenPo to this dashboard by entering their email addresses.